ELK笔记
ELK笔记
# ELK安装
# 1.前期准备
1.1 关闭防火墙 systemctl stop firewalld && systemctl disable firewalld
1.2 关闭SELINUX sed -i 's#SELINUX=enforcing#SELINUX=disabled#g' /etc/selinux/config
1.3 安装JDK yum install -y java-1.8*
1.4 下载安装包
mkdir /opt/soft && cd /opt/soft
wget https://artifacts.elastic.co/downloads/elasticsearch/elasticsearch-6.2.3.tar.gz
wget https://artifacts.elastic.co/downloads/logstash/logstash-6.2.3.tar.gz
wget https://artifacts.elastic.co/downloads/kibana/kibana-6.2.3-linux-x86_64.tar.gz
tar xf elasticsearch-6.2.3.tar.gz -C /opt/ tar xf logstash-6.2.3.tar.gz -C /opt/ tar xf kibana-6.2.3-linux-x86_64.tar.gz -C /opt/
# 2.配置elasticsearch
2.1 新建用户 useradd elast chown -R elast.elast /opt/elast
2.2 修改配置文件 cd /opt/elast/config cp elasticsearch.yml elasticsearch.yml.bak
vim elasticsearch.yml
cluster.name: ELK-Cluster node.name: master-node path.data: /opt/elast path.logs: /opt/elast/logs network.host: 192.168.200.238 http.port: 9200
2.3 优化内核
echo "vm.max_map_count=262144" >> /etc/sysctl.conf sysctl -p
vim /etc/security/limits.conf
- soft nproc 65536
- hard nproc 65536
- soft nofile 65536
- hard nofile 65536
2.4 启动 su - elast cd /opt/elast ./bin/elasticsearch –d
# 3.配置logstash
Logstash 收集 nginx 日志之使用 grok 过滤插件解析日志,grok 作为一个 logstash 的过滤插件,支持根据模式解析文本日志行,拆成字段。
3.1 新建配置文件
cd /opt/logstash/config/conf.d vim logstash.conf
input {
    file {
        path => ["/var/log/messages"]
        type => "syslog"
    }
}

filter {
    grok {
        match => [ "message", "%{SYSLOGBASE} %{GREEDYDATA:conte
nt}" ]
    }
}

output {
    elasticsearch {
        hosts => ["192.168.200.238:9200"]
        index => "syslog-%{+YYY.MM.dd}"
    }
}
2
3
4
5
6
7
8
9
10
11
12
13
14
15
16
17
18
19
20
3.2 启动
./logstash -f /opt/logstash/config/logstash.conf &
# 4.安装kibana
4.1 修改配置文件
cd /opt/kibana/config cp kibana.yml kibana.yml.bak vim kibana.yml
server.port: 5601 server.host: 192.168.200.238 elasticsearch.url: "http://192.168.200.238:9200" logging.dest: /var/log/kibana.log
touch /var/log/kibana.log chmod 777 /var/log/kibana.log
4.2 启动
/opt/kibana/bin/kibana &
# 5.使用RPM安装
rpm --import https://artifacts.elastic.co/GPG-KEY-elasticsearch
rpm --install logstash-6.8.0.rpm rpm --install kibana-6.8.0-x86_64.rpm rpm --install elasticsearch-6.8.0.rpm
# 6.yum安装
6.1 安装 kibana
cat >/etc/yum.repos.d/kibana.repo <<EOF [kibana-6.x] name=Kibana repository for 6.x packages baseurl=https://artifacts.elastic.co/packages/6.x/yum gpgcheck=1 gpgkey=https://artifacts.elastic.co/GPG-KEY-elasticsearch enabled=1 autorefresh=1 type=rpm-md
yum install kibana
6.2 安装logstash
cat >/etc/yum.repos.d/logstash.repo <<EOF [logstash-6.x] name=Elastic repository for 6.x packages baseurl=https://artifacts.elastic.co/packages/6.x/yum gpgcheck=1 gpgkey=https://artifacts.elastic.co/GPG-KEY-elasticsearch enabled=1 autorefresh=1 type=rpm-md EOF
sudo yum install logstash
6.3 安装elasticsearch
cat >/etc/yum.repos.d/elasticsearch.repo <<EOF [elasticsearch-6.x] name=Elasticsearch repository for 6.x packages baseurl=https://artifacts.elastic.co/packages/6.x/yum gpgcheck=1 gpgkey=https://artifacts.elastic.co/GPG-KEY-elasticsearch enabled=1 autorefresh=1 type=rpm-md
sudo yum install elasticsearch
# 7.filebeat安装部署
filebeat是一款轻量级的数据采集器,需要部署在每台需要收集日志的机器上。安装和配置过程很方便,如果机器很多,可以配合使用批量部署工具进行安装。
安装 linux 平台使用 rpm安装 curl -L -O https://artifacts.elastic.co/downloads/beats/filebeat/filebeat-6.8.0-x86_64.rpm sudo rpm -vi filebeat-6.8.0-x86_64.rpm
编辑配置
修改 filebeat.yml 以设置连接信息:
output.elasticsearch:
hosts: ["<es_url>"]
username: "elastic"
password: "
其中,
3 启用和配置 system 模块 从安装目录中,运行: ./filebeat modules enable system 在 modules.d/system.yml 文件中修改设置。
4 启动 Filebeat setup 命令加载 Kibana 仪表板。如果仪表板已设置,请省略此命令。 sudo filebeat setup sudo service filebeat start 模块状态 确认已从 Filebeat system 模块成功收到数据
# ELK笔记
# 1. ELK基础知识
# 1.1 什么是ELK
ELK是Elasticsearch + Logstash + Kibana 这种架构的简写。这是一种日志分平台析的架构。从前我们用shell三剑客(grep, sed, awk)来分析日志, 虽然也能对付大多数场景,但当日志量大,分析频繁,并且使用者可能不会shell三剑客的情况下, 配置方便,使用简单,并且分析结果更加直观的工具(平台)就诞生了,它就是ELK。 ELK是开源的,并且社区活跃,用户众多。当然国内也有一些收费的,比较好用的日志分析平台,比如日志易(日志易的同事赶紧给我打钱,毕竟这广告打的好)。
# 1.2 ELK常见的几种架构1 Elasticsearch + Logstash + Kibana
这是一种最简单的架构。这种架构,通过logstash收集日志,Elasticsearch分析日志,然后在Kibana(web界面)中展示。这种架构虽然是官网介绍里的方式,但是往往在生产中很少使用。2 Elasticsearch + Logstash + filebeat + Kibana
与上一种架构相比,这种架构增加了一个filebeat模块。filebeat是一个轻量的日志收集代理,用来部署在客户端,优势是消耗非常少的资源(较logstash), 所以生产中,往往会采取这种架构方式,但是这种架构有一个缺点,当logstash出现故障, 会造成日志的丢失。3 Elasticsearch + Logstash + filebeat + redis(也可以是其他中间件,比如kafka) + Kibana
这种架构是上面那个架构的完善版,通过增加中间件,来避免数据的丢失。当Logstash出现故障,日志还是存在中间件中,当Logstash再次启动,则会读取中间件中积压的日志。目前我司使用的就是这种架构,我个人也比较推荐这种方式。
说明: logstash节点和elasticsearch节点可以根据日志量伸缩数量, filebeat部署在每台需要收集日志的服务器上。
elasticsearch 数据库,存数据
logstash 收集日志,过滤数据
kibana 分析,过滤,展示
filebeat 收集日志,传输到ES
beats 数据采集
filebeat packetbeat metricbeat wirlogbeat heartbeat
直接发送给elasticsearch或者经过logstash处理后发给elasticsearch
elasticsearch 基于RESTful web接口 企业级搜索引擎
Elasticsearch 是个开源分布式搜索引擎,提供搜集、分析、存储数据三大功能。它的特点有:分布式,
零配置,自动发现,索引自动分片,索引副本机制,restful 风格接口,多数据源,自动搜索负载等。
Logstash 主要是用来日志的搜集、分析、过滤日志的工具,支持大量的数据获取方式。一般工作方式为 c/s 架构,client 端安装在需要收集日志的主机上,server
端负责将收到的各节点日志进行过滤、修改等操作在一并发往 elasticsearch 上去。
elasticsearch搜索原理
正排索引和倒排索引
# 2. ELK配置
1、开发人员为了排除问题,经常要上线服务器去查询项目日志
2、项目越来越多,日志也越来越多
3、图文展示
# 2.1 查看健康状态
curl http://192.168.200.238:9200/_cat/health?v
curl -X PUT "192.168.200.238:9200/customer/_doc/1?pretty" -H 'Content-Type: application/json' -d'
{
"name": "John Doe"
}'
curl -X GET "localhost:9200/customer/_doc/1?pretty"
wget https://raw.githubusercontent.com/elastic/elasticsearch/master/docs/src/test/resources/accounts.json
curl -H "Content-Type: application/json" -XPOST "localhost:9200/bank/_doc/_bulk?pretty&refresh" --data-binary "@accounts.json"
curl "localhost:9200/_cat/indices?v"
curl -X GET "localhost:9200/bank/_search?pretty" -H 'Content-Type: application/json' -d'
{
"query": { "match_all": {} },
"sort": [
{ "account_number": "asc" }
]
}'
curl -X GET "localhost:9200/bank/_search?pretty" -H 'Content-Type: application/json' -d'
{
"query": { "match_all": {} },
"sort": [
{ "account_number": "asc" }
],
"from": 10,
"size": 10
}
'
curl -X GET "localhost:9200/bank/_search?pretty" -H 'Content-Type: application/json' -d'
{
"query": { "match": { "address": "mill lane" } }
}
'
curl -X GET "localhost:9200/bank/_search?pretty" -H 'Content-Type: application/json' -d'
{
"query": { "match_phrase": { "address": "mill lane" } }
}
'
curl -X GET "localhost:9200/bank/_search?pretty" -H 'Content-Type: application/json' -d'
{
"query": {
"bool": {
"must": [
{ "match": { "age": "40" } }
],
"must_not": [
{ "match": { "state": "ID" } }
]
}
}
}'
curl -X GET "localhost:9200/bank/_search?pretty" -H 'Content-Type: application/json' -d'
{
"query": {
"bool": {
"must": { "match_all": {} },
"filter": {
"range": {
"balance": {
"gte": 20000,
"lte": 30000
}
}
}
}
}
}'
2
3
4
5
6
7
8
9
10
11
12
13
14
15
16
17
18
19
20
21
22
23
24
25
26
27
28
29
30
31
32
33
34
35
36
37
38
39
40
41
42
43
44
45
46
47
48
49
50
51
52
53
54
55
56
57
58
59
60
61
# 2.2 安装可视化web界面
https://github.com/mobz/elasticsearch-head
无法连接集群 在elasticsearch.yml 添加以下两行 重启elastic
http.cors.enabled: true
http.cors.allow-origin: "*"
# 2.3 kibana设置用户密码
1.使用x-pax
2.使用nginx第三方给http加密
auth_basic "Please input user and password";
auth_basic_user_file /opt/nginx/conf/conf.d/passwd.db;
openssl passwd -crypt 123456
echo "wangkai:Y7ewBcZVm2DI." >passwd.db
# 2.4 使用redis配合logstash做队列缓冲
设置redis密码和监听地址
requirepass 123456
bind 0.0.0.0
input {
    redis {
        host => ["192.168.200.238:6379"]
        password => "123456"
        db => "0"
        data_type => "list"
        key => "nginx-redis"
    }
}
2
3
4
5
6
7
8
9
# 2.5 elasticsearch_restfull请求
http://192.168.1.232:9200/haoke/user/_search
_search 搜索
_update 更新数据
_bulk 批量操作
_mget 批量查询
判断文档是否存在
HEAD /haoke/user/1005
查询响应
http://192.168.1.232:9200/haoke/user/1001?pretty
指定响应字段
GET /haoke/user/1005?_source=id,name
GET /haoke/user/1005/_source
# 2.6 elasticsearch报错
[1]: the default discovery settings are unsuitable for production use; at least one of [discovery.seed_hosts, discovery.seed_providers, cluster.initial_master_nodes] must be configured 修改 elasticsearch.yml 取消注释保留一个节点 cluster.initial_master_nodes: ["node-1"]
②[x]: max file descriptors [4096] for elasticsearch process is too low, increase to at least [65536]
vim /etc/security/limits.conf
* soft nproc 65536
* hard nproc 65536
* soft nofile 65536
* hard nofile 65536
③[x]: max virtual memory areas vm.max_map_count [65530] is too low, increase to at least [262144]
vim /etc/sysctl.conf
vm.max_map_count=262144
保存退出,sysctl -p 不重启使配置生效
elasticsearch 集群无法启动出现如下提示 failed to send join request to master
原因是:是因为复制的elasticsearch文件夹下包含了data文件中示例一的节点数据,需要把示例二data文件下的文件清空。
删除es集群data数据库文件夹下所有文件即可
# 2.7 elasticsearch集群配置
cluster.name: es-itcast-cluster
node.name: node01
node.master: true
node.data: true
network.host: 0.0.0.0
http.port: 9200
discovery.zen.ping.unicast.hosts: ["192.168.200.232","192.168.200.233","192.168.200.234"]
discovery.zen.minimum_master_nodes: 2
http.cors.enabled: true
http.cors.allow-origin: "*"

cluster.name: es-itcast-cluster
node.name: node02
node.master: true
node.data: true
network.host: 0.0.0.0
http.port: 9200
discovery.zen.ping.unicast.hosts: ["192.168.200.232","192.168.200.233","192.168.200.234"]
discovery.zen.minimum_master_nodes: 2
http.cors.enabled: true
http.cors.allow-origin: "*"

cluster.name: es-itcast-cluster
node.name: node03
node.master: true
node.data: true
network.host: 0.0.0.0
http.port: 9200
discovery.zen.ping.unicast.hosts: ["192.168.200.232","192.168.200.233","192.168.200.234"]
discovery.zen.minimum_master_nodes: 2
http.cors.enabled: true
2
3
4
5
6
7
8
9
10
11
12
13
14
15
16
17
18
19
20
21
22
23
24
25
26
27
28
29
30
31
http.cors.allow-origin: "*"
# 3.filebeat+redis+logstash+eslaticsearch+kibana配置
版本 6.8
# 3.1 filebeat配置
filebeat.inputs:
- type: log
 enabled: true
 paths:
  - /opt/nginx/logs/access.log
 fields:
  log_source: nginx-access
- type: log
 enabled: true
 paths:
  - /opt/nginx/logs/error.log
 fields:
  log_source: nginx-error
filebeat.config.modules:
 path: ${path.config}/modules.d/*.yml
 reload.enabled: false
setup.template.settings:
 index.number_of_shards: 3
setup.kibana:
output.redis:
 hosts: ["192.168.200.238:6379"]
 password: "123456"
 key: "nginx_redis"
 db: 0
 datatype: list
processors:
 - add_host_metadata: ~
 - add_cloud_metadata: ~
2
3
4
5
6
7
8
9
10
11
12
13
14
15
16
17
18
19
20
21
22
23
24
25
26
27
28
配置文件
filebeat 配置文件比较简单, 只需要配置一个filebeat.yml
#============== Filebeat prospectors ===========
filebeat.inputs: # 6.3以前是 filebeat.prospectors:
- type: log # input类型,默认为log,6.0以前配置是 - input_type: log
paths:
- /var/log/java/test-java.log
- /var/log/java/.log
- /var/log//*.log
fields:
log_topic: java_log # 附加的可选字段,以向output添加额外的信息。output里面可以使用这个变量
multiline.pattern: '^[' #多行合并 同logstash的multiline用法相似
multiline.negate: true
multiline.match: after
- type: log # 一个配置文件里面可以同时收集多个日志 enabled: true paths: - /var/log/nginx/*.log fields: my_log_topic: nginx_log
常用配置
type: 指定input类型,有log、stdin、redis、tcp、syslog等
fields: 可以自定义添加字段,到output中去,后续可以使用这些字段,例如:
fields: log_topic: mysql_slow idc: szjf tail_files: 默认为false。配置为true时,filebeat将从新文件的最后位置开始读取,而不是从开头读取新文件, 注意:如果配合日志轮循使用,新文件的第一行将被跳过。
此选项适用于Filebeat尚未处理的文件。如果先前运行了Filebeat并且文件的状态已经保留,tail_files则不会应用。
第一次运行Filebeat时,可以使用 tail_files: true 来避免索引旧的日志行。第一次运行后,建议禁用此选项。
output
配置输出的位置,比如kafka,logstash,es,redis,file 等
复制代码 #================================ Outputs ===================================== #-------------------------Kafka output ------------------------------
output.kafka:
 hosts: ["kafka01:9092","kafka02:9092","kafka03:9092]
 topic: '%{[fields.my_log_topic]}'
 partition.round_robin:
  reachable_only: false
 version: 0.10.0.0
 required_acks: 1
 compression: none
 max_message_bytes: 1000000
#output.logstash:
# hosts: ["localhost:5044"]


filebeat创建nginx仪表盘

setup.kibana:
 host: "192.168.200.238:5601"
2
3
4
5
6
7
8
9
10
11
12
13
14
15
16
17
filebeat -c filebeat.yml setup
kibana自定义图表
可视化-添加-图表类型
# 3.2 logstash配置
output {
  if "nginx-access" in [fields][log_source] {
  elasticsearch {
    hosts => ["192.168.200.238:9200"]
    index => "nginx-access-%{+YYY.MM.dd}"
  }
}

  if "nginx-error" in [fields][log_source] {
  elasticsearch {
    hosts => ["192.168.200.238:9200"]
    index => "nginx-error-%{+YYY.MM.dd}"
  }
}
}
2
3
4
5
6
7
8
9
10
11
12
13
14
15
# 4. filebeat配置
# 4.1 收集nginx的JSON日志
log_format access_json '{ "@timestamp": "$time_iso8601", '
             '"time": "$time_iso8601", '
             '"remote_addr": "$remote_addr", '
             '"remote_user": "$remote_user", '
             '"body_bytes_sent": "$body_bytes_sent", '
             '"request_time": "$request_time", '
             '"status": "$status", '
             '"host": "$host", '
             '"request": "$request", '
             '"request_method": "$request_method", '
             '"uri": "$uri", '
             '"http_referrer": "$http_referer", '
             '"body_bytes_sent":"$body_bytes_sent", '
             '"http_x_forwarded_for": "$http_x_forwarded_for", '
             '"http_user_agent": "$http_user_agent" '
          '}';
2
3
4
5
6
7
8
9
10
11
12
13
14
15
16
使用不正常的日志变量会导致JSON输出到elasticsearch失效
在filebeat.yml加入json配置 json.keys_under_root: true json.overwrite_keys: true
# 4.2 在filebeat.yml设置es索引重新命名
index: "nginx-access-%{[beat.version]}-%{+yyyy.MM}" setup.template.name: "nginx" setup.template.pattern: "nginx-*"
# 4.3 收集tomcat的JSON日志
vim /opt/tomcat/conf/server.xml 在162行替换掉pattern的内容 pattern="{"clientip":"%h","ClientUser":"%l","authenticated":"%u","AccessTime":"%t","method":"%r","status":"%s","SendBytes":"%b","Query?string":"%q","partner":"%{Referer}i","AgentVersion":"%{User-Agent}i"}"/>
# 4.4 收集JAVA多行日志
在filebeat.yml的paths同级加入 multiline.pattern: '^[' multiline.negate: true multiline.match: after
# 4.5 收集docker日志
filebeat.inputs:
- type: docker
 containers.ids:
  - '8b6fe7dc9e067b58476dc57d6986dd96d7100430c5de3b109a99cd56ac655347'

filebeat.inputs:
- type: log
 enabled: true
 paths:
  - /var/lib/docker/containers/*/*json.log
2
3
4
5
6
7
8
9
10
收集多个docker容器的日志
# 4.6 Filebeat 自带的模块modules收集日志
Nginx,mongo,redis,mysql
必须先在filebeat.yml配置 filebeat modules enable nginx filebeat modules list
elasticserach安装插件 elasticsearch-plugin install ingest-user-agent elasticsearch-plugin install ingest-geoip
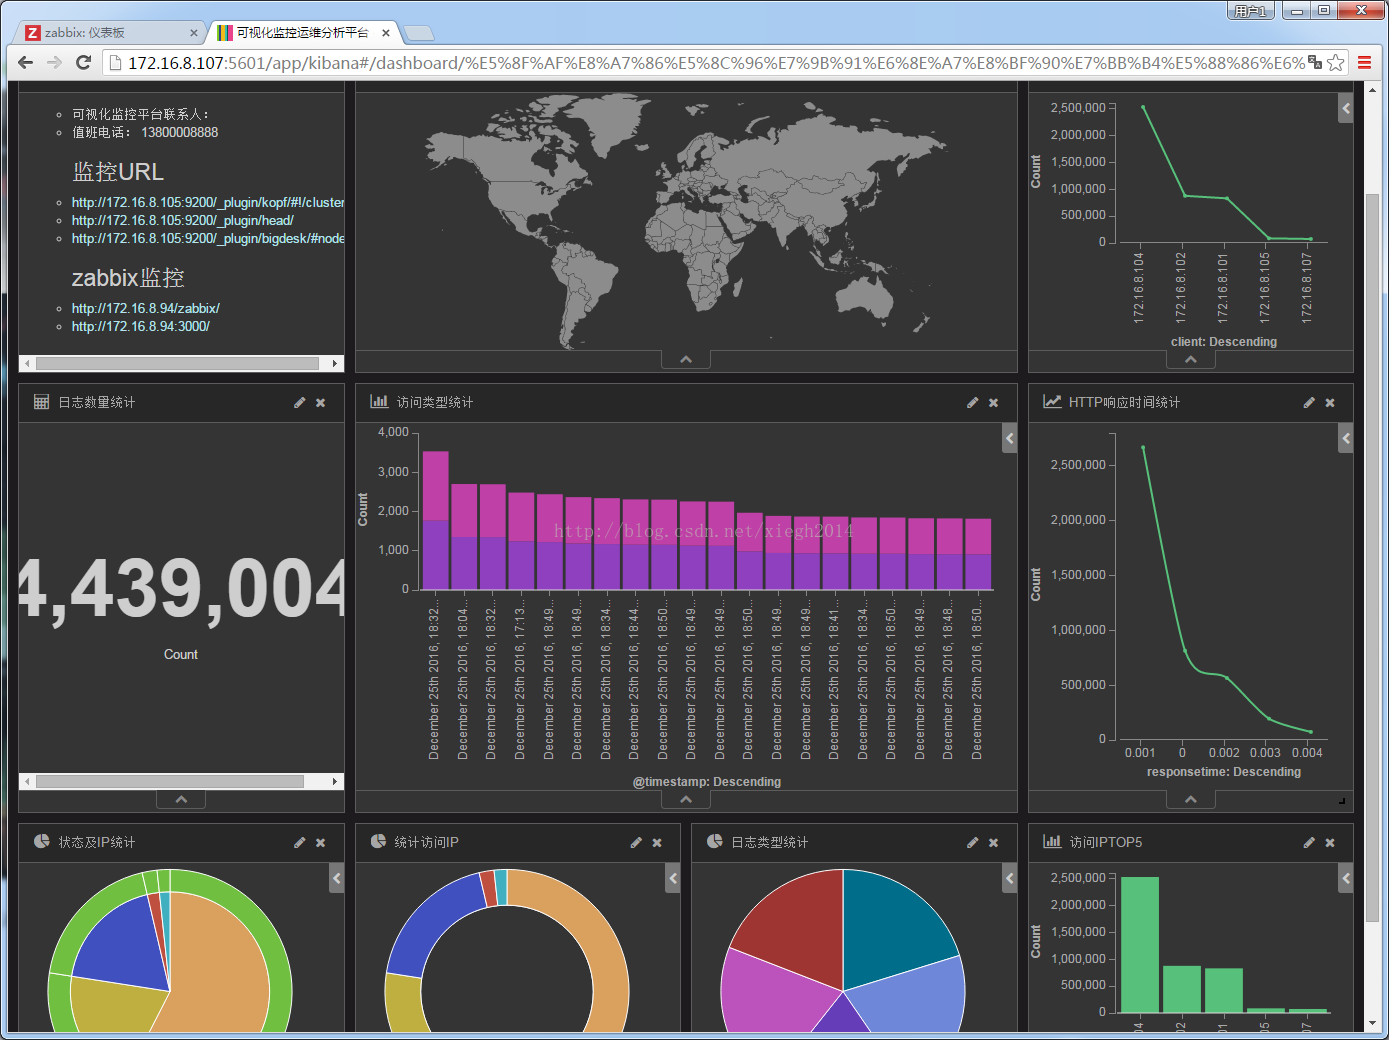
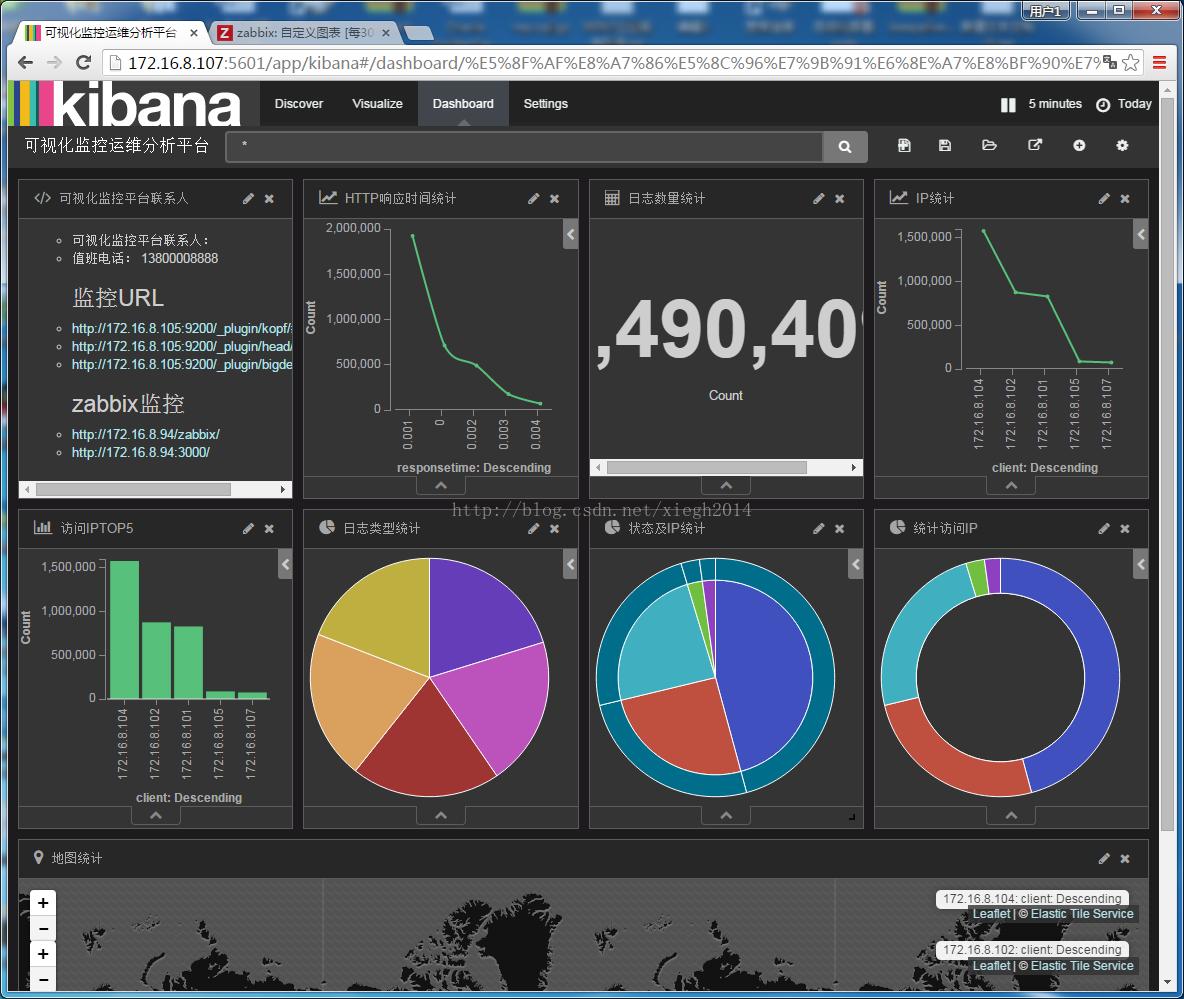
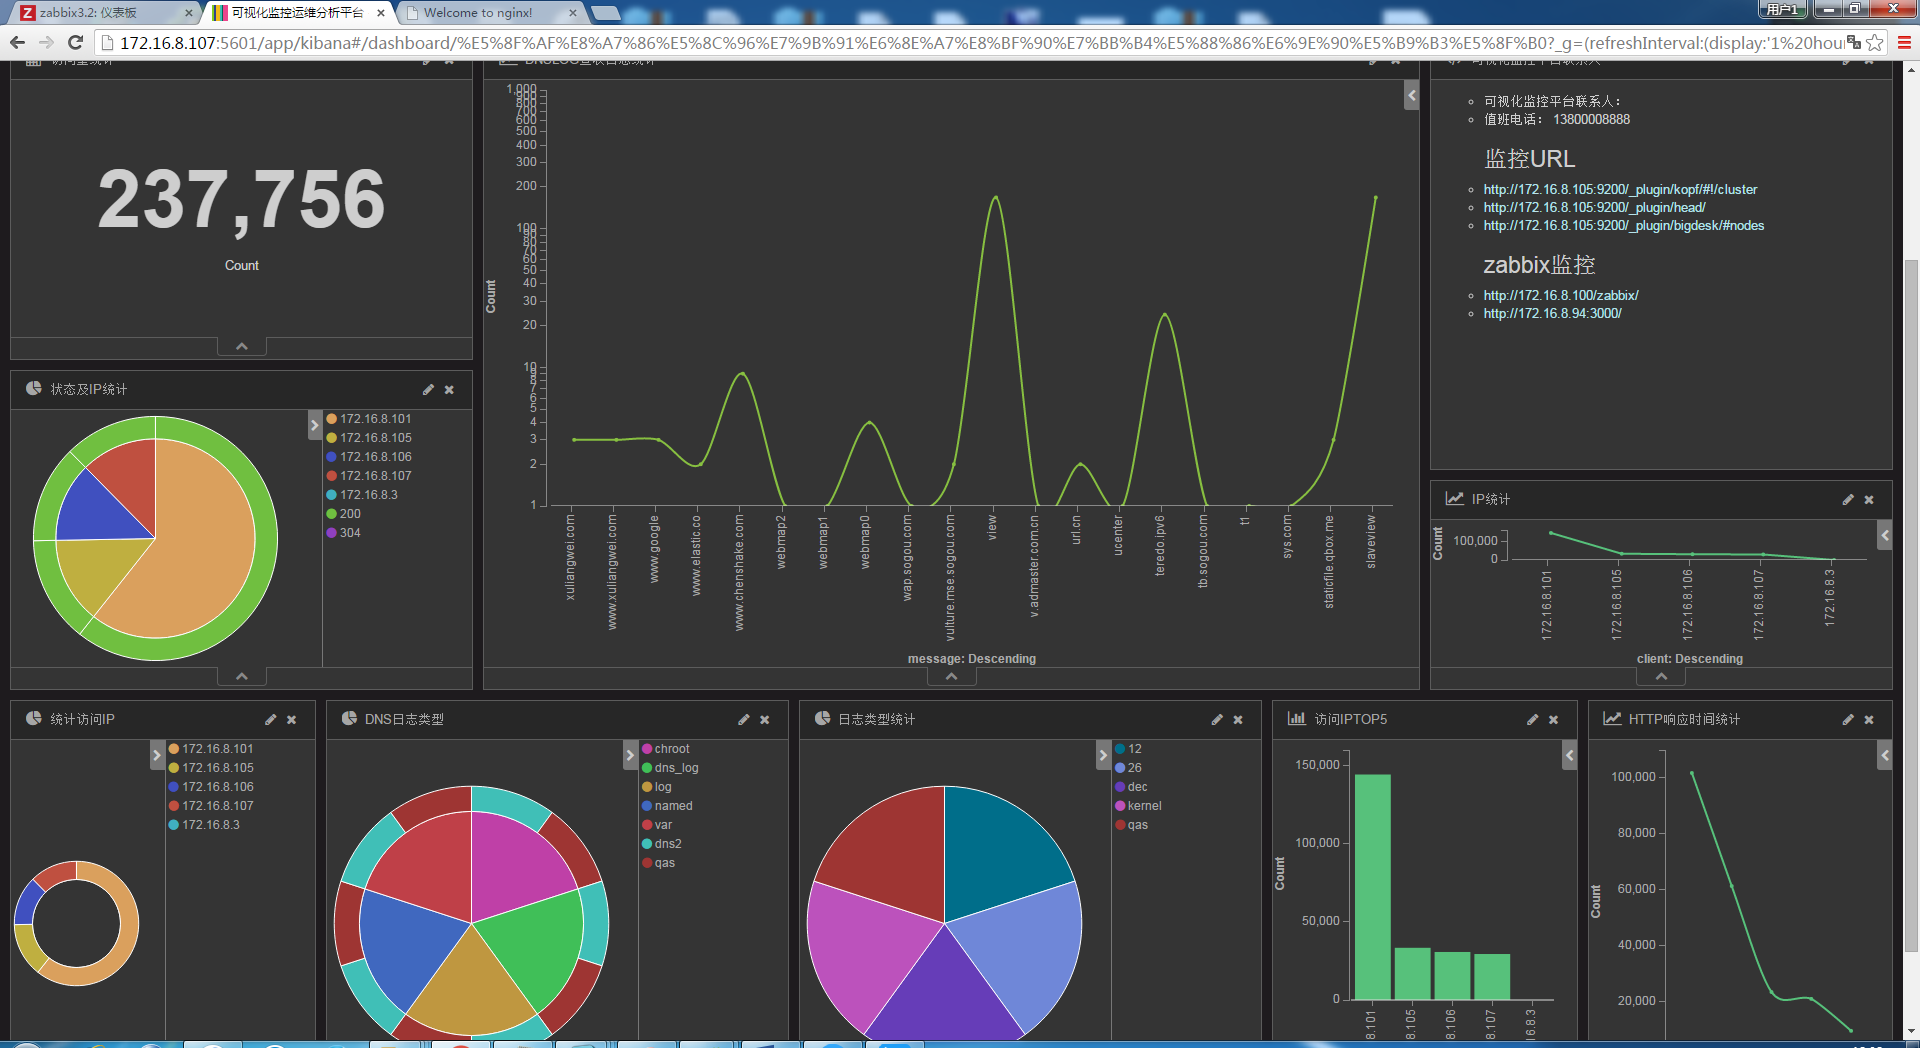
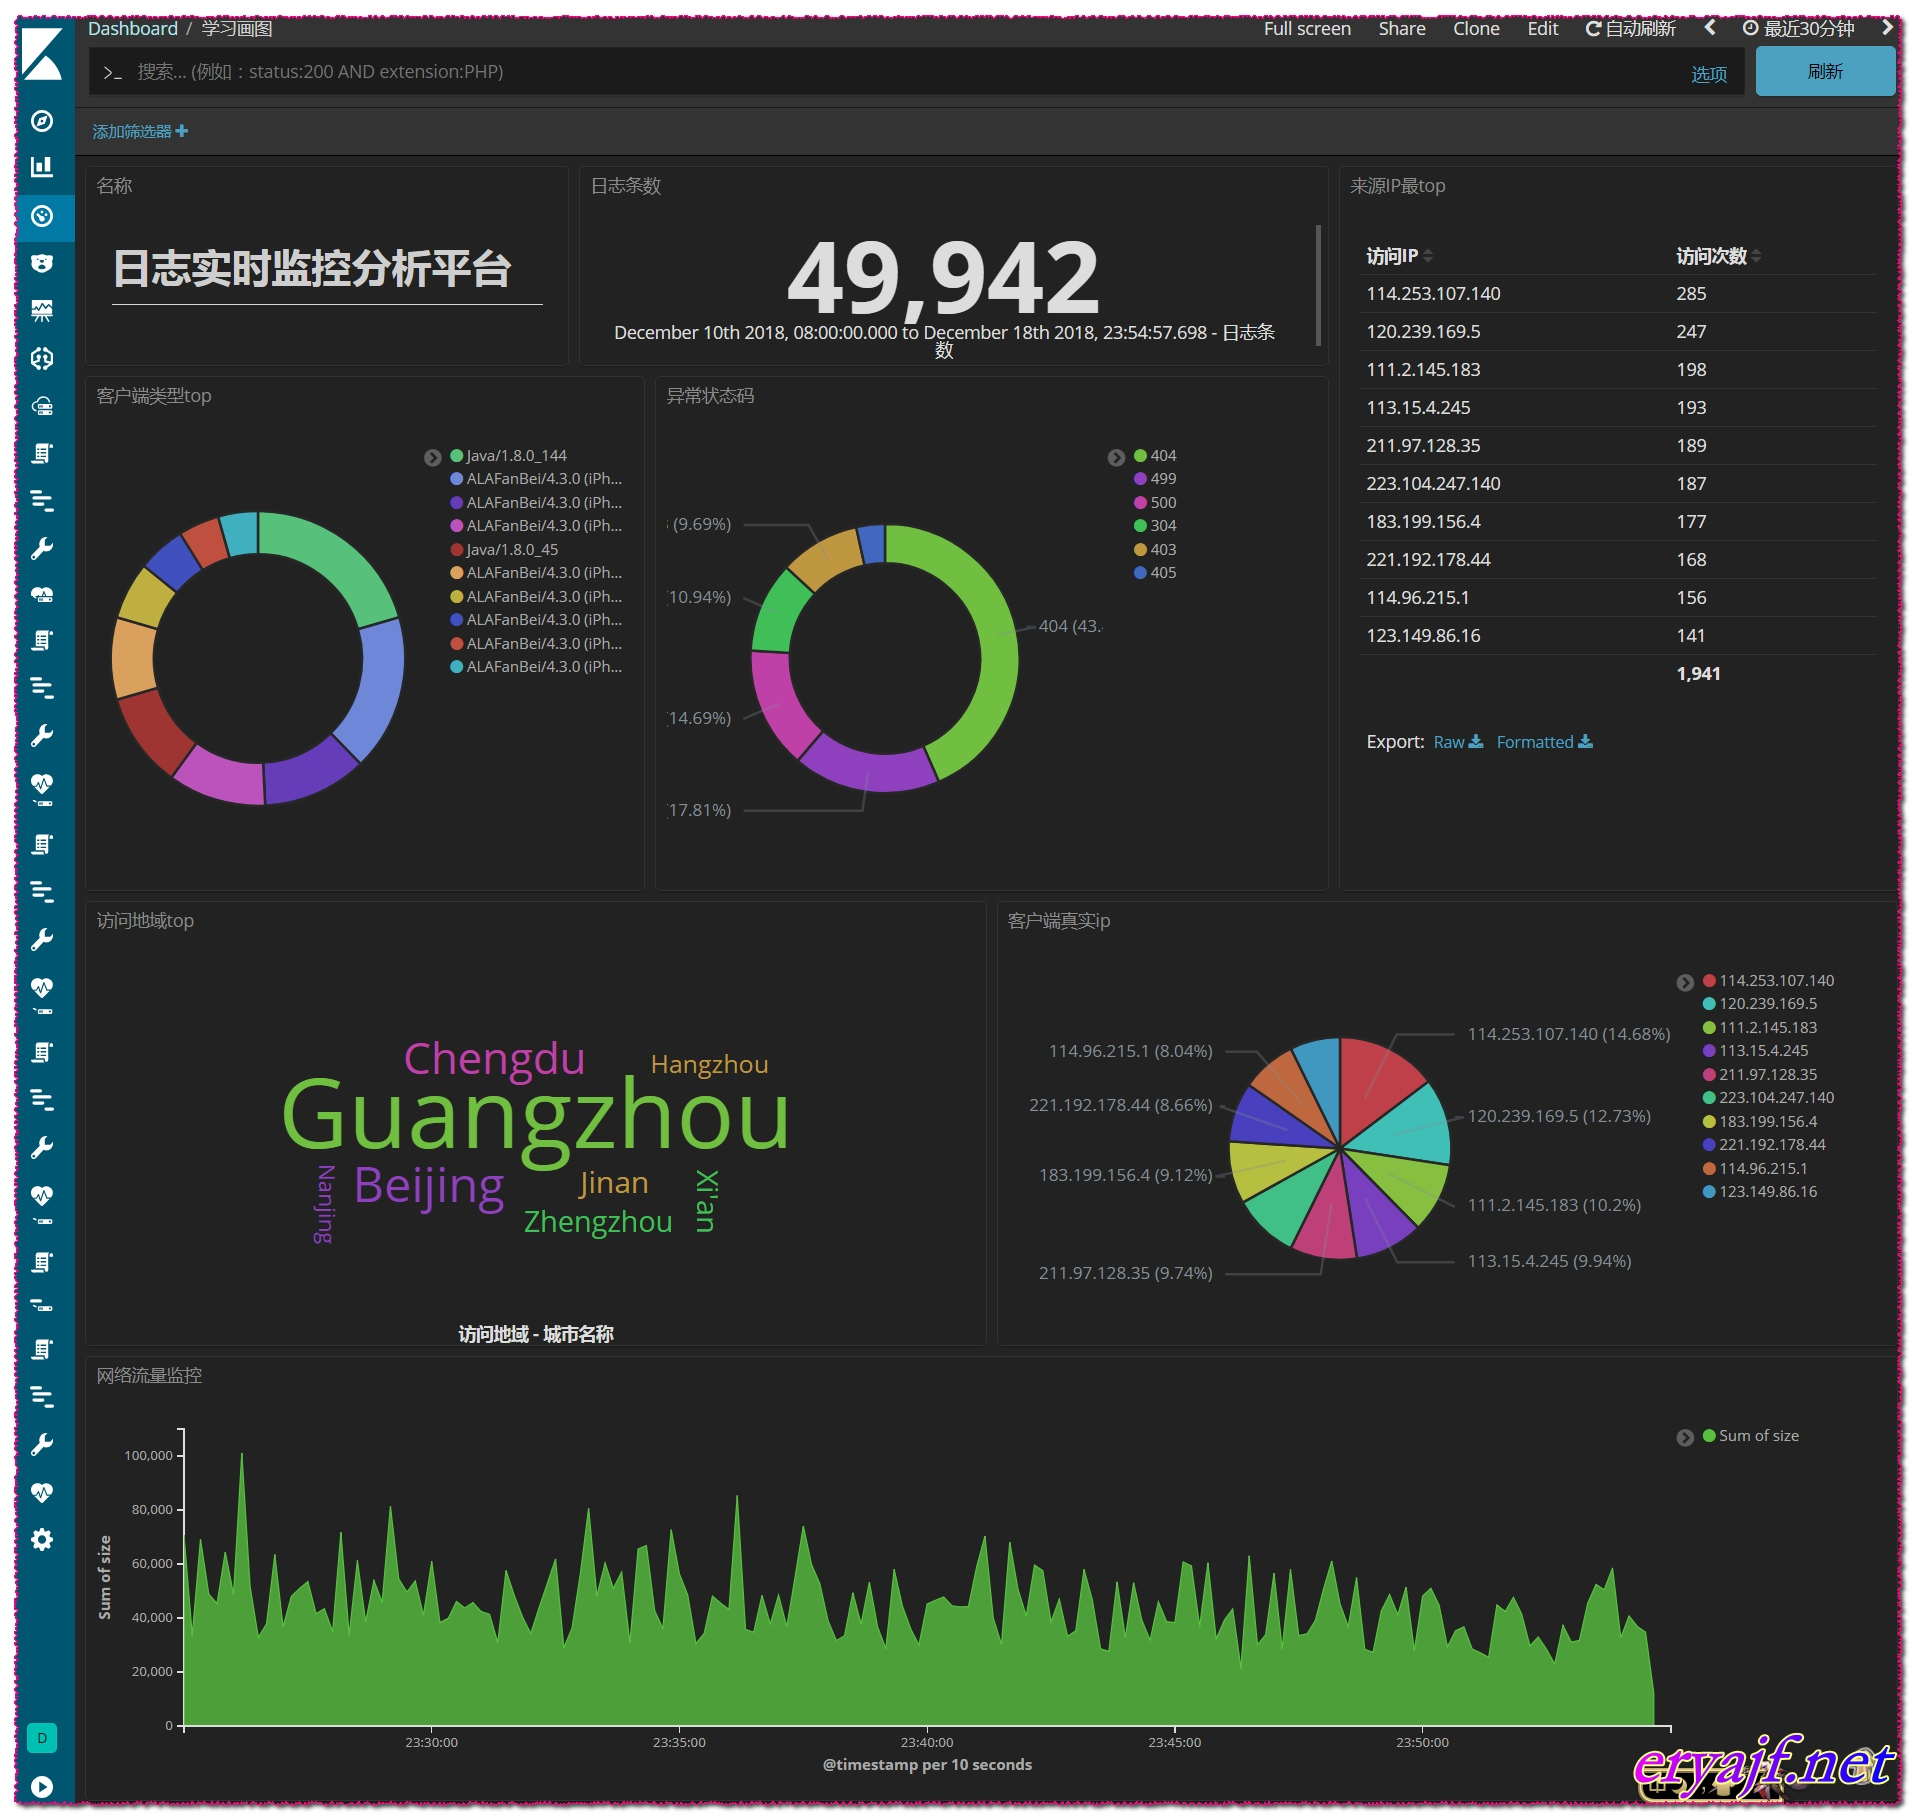
# 5. kibana画图
柱状图
拆线图
饼图
仪表图
拼接大屏展示
巧用ELK快速实现网站流量监控可视化 https://blog.csdn.net/qq_41699100/article/details/81102719
# 6. 使用redis作为缓存
filebeat配置 output.redis: hosts: ["192.168.200.238:6379"] data_type: "list" password: "123456" key: "nginx-test" db: 0
logstash 配置文件
input {
 redis {
  host => "192.168.200.238"
  port => 6379
  password => 123456
  data_type => "list"
  key => "nginx-test"
  db => 0
}
}


output {
 if [fields][log_source] == 'access' {
  elasticsearch {
   hosts => ["http://192.168.200.211:9200","http://192.168.200.212","http://192.168.200.213"]
   index => "nginx-access-%{+YYYY.MM.dd}"
 }
}

 if [fields][log_source] == 'error' {
  elasticsearch {
   hosts => ["http://192.168.200.211:9200","http://192.168.200.212","http://192.168.200.213"]
   index => "nginx-error-%{+YYYY.MM.dd}"
 }
}
}
2
3
4
5
6
7
8
9
10
11
12
13
14
15
16
17
18
19
20
21
22
23
24
25
26
27
# 7. kibana监控ES集群
利用x-pack监控ES集群
使用kafka作为缓存
# 8.删除索引
1、 #删除指定索引 curl -XDELETE -u elastic:changeme http://localhost:9200/acc-apply-2018.08.09 {"acknowledged":true}
2、#删除多个指定索引,中间用逗号隔开 curl -XDELETE -u elastic:changeme http://localhost:9200/acc-apply-2018.08.09,acc-apply-2018.08.10
3、#模糊匹配删除
curl -XDELETE -u elastic:changeme http://localhost:9200/acc-apply-*
4、#使用通配符,删除所有的索引 curl -XDELETE http://localhost:9200/_all 或 curl -XDELETE http://localhost:9200/*
# 9.配置文件参考
# 9.1 filebeat
filebeat.inputs:
- type: log
  enabled: true
  paths:
    - /var/log/nginx/*.log
  json.message_key: log
  json.keys_under_root: true
  fields:
    log_topic: nginx-192.168.5.159     # 附加的可选字段,以向output添加额外的信息。output里面可以使用这个变量
  #multiline.pattern: ^\-{63}   #多行合并 同logstash的multiline用法相似
  #multiline.negate: true
  #multiline.match: after
output.elasticsearch:
  # Array of hosts to connect to.
  hosts: ["192.168.5.30:9200"]
  index: "nginx-192.168.5.159index-%{+yyyy.MM.dd}"
setup.template.name: "filebeattest"
setup.template.pattern: "filebeattest-*"


filebeat.inputs:
#################nginx#############
- type: log
  enabled: true
  paths:
    - /var/log/nginx/access.log
  json.keys_under_root: true
  json.overwrite_keys: true
  tags: ["access"]

- type: log
  enabled: true
  paths:
    - /var/log/nginx/error.log
  tags: ["error"]

#################tomcat#############
- type: log
  enabled: true
  paths:
    - /var/log/tomcat/localhost_access_log.*.txt
  json.keys_under_root: true
  json.overwrite_keys: true
  tags: ["tomcat"]

#################es#############
- type: log
  enabled: true
  paths:
    - /var/log/elasticsearch/elasticsearch.log
  tags: ["es"]
  multiline.pattern: '^\['
  multiline.negate: true
  multiline.match: after
#################output#############
setup.kibana:
  host: "10.0.0.51:5601"

output.elasticsearch:
  hosts: ["10.0.0.51:9200"]
  #index: "nginx-%{[beat.version]}-%{+yyyy.MM}"
  indices:
    - index: "nginx-access-%{[beat.version]}-%{+yyyy.MM}"
      when.contains:
        tags: "access"
    - index: "nginx-error-%{[beat.version]}-%{+yyyy.MM}"
      when.contains:
        tags: "error"
    - index: "tomcat-access-%{[beat.version]}-%{+yyyy.MM}"
      when.contains:
        tags: "tomcat"
    - index: "es-java-%{[beat.version]}-%{+yyyy.MM}"
      when.contains:
        tags: "es"

setup.template.name: "nginx"
setup.template.pattern: "nginx-*"
setup.template.enabled: false
setup.template.overwrite: true
2
3
4
5
6
7
8
9
10
11
12
13
14
15
16
17
18
19
20
21
22
23
24
25
26
27
28
29
30
31
32
33
34
35
36
37
38
39
40
41
42
43
44
45
46
47
48
49
50
51
52
53
54
55
56
57
58
59
60
61
62
63
64
65
66
67
68
69
70
71
72
73
74
75
76
77
78
79
# 9.2 filebeat6.8
filebeat.inputs:
- type: log
  enabled: true
  paths:
  - /opt/nginx/logs/*.log
  tags: ["nginx-access"]
  fields:
  from: nginx-access
  fields_under_root: false
setup.template.settings:
  index.number_of_shards: 3
output.elasticsearch:
  hosts: ["192.168.200.238:9200"]
2
3
4
5
6
7
8
9
10
11
12
13
# 9.3 docker
filebeat.inputs:
- type: docker
  containers.ids:
     - 'ef5c0310f7553e67c68fc909339b1a97b7560d003d8077ffc2a46294572513cd'
  tags: ["access"]
output.elasticsearch:
  hosts: ["192.168.200.211:9200","192.168.200.212:9200","192.168.200.213:9200"]
  indices:
   - index: "docker-%{[beat.version]}-%{+yyyy.MM}"
     when.contains:
       tags: "access"
setup.template.name: "docker"
setup.template.pattern: "docker-*"


filebeat.inputs:
- type: log
  enabled: true
  paths:
    - /var/lib/docker/containers/*/*json.log
  tags: ["access"]
output.elasticsearch:
  hosts: ["192.168.200.211:9200","192.168.200.212:9200","192.168.200.213:9200"]
  indices:
   - index: "docker-json-%{[beat.version]}-%{+yyyy.MM}"
     when.contains:
       tags: "access"
setup.template.name: "docker"
setup.template.pattern: "docker-*"


filebeat.inputs:
- type: log
  enabled: true
  paths:
    - /var/lib/docker/containers/*/*json.log
  tags: ["access"]
output.elasticsearch:
  hosts: ["192.168.200.211:9200","192.168.200.212:9200","192.168.200.213:9200"]
  indices:
   - index: "docker-nginx-access-%{[beat.version]}-%{+yyyy.MM}"
     when.contains:
	   attrs.service: "nginx"
	   stream: "stdout"

   - index: "docker-nginx-error-%{[beat.version]}-%{+yyyy.MM}"
     when.contains:
	   attrs.service: "nginx"
	   stream: "stderr"

   - index: "docker-tomcat-access-%{[beat.version]}-%{+yyyy.MM}"
     when.contains:
	   attrs.service: "tomcat"
	   stream: "stdout"

   - index: "docker-tomcat-error-%{[beat.version]}-%{+yyyy.MM}"
     when.contains:
	   attrs.service: "tomcat"
	   stream: "stderr"

setup.template.name: "docker"
2
3
4
5
6
7
8
9
10
11
12
13
14
15
16
17
18
19
20
21
22
23
24
25
26
27
28
29
30
31
32
33
34
35
36
37
38
39
40
41
42
43
44
45
46
47
48
49
50
51
52
53
54
55
56
57
58
59
60
61
62
63
64
65
# 9.4 tomcat
filebeat.inputs:
- type: log
  enabled: true
  paths:
    - /opt/tomcat8.5/logs/localhost_access_log*.txt
  json.keys_under_root: true
  overwrite_keys: true
  tags: ["access"]
output.elasticsearch:
  hosts: ["192.168.200.211:9200","192.168.200.212:9200","192.168.200.213:9200"]
  indices:
   - index: "tomcat-access-%{[beat.version]}-%{+yyyy.MM}"
     when.contains:
       tags: "access"
setup.template.name: "tomcat"
setup.template.pattern: "tomcat-*"
2
3
4
5
6
7
8
9
10
11
12
13
14
15
16
# 9.5 nginx
filebeat.inputs:
- type: log
  enabled: true
  paths:
    - /opt/nginx/logs/access.log
  json.keys_under_root: true
  overwrite_keys: true
  tags: ["access"]
- type: log
  enabled: true
  paths:
    - /opt/nginx/logs/error.log
  tags: ["error"]
output.elasticsearch:
  hosts: ["192.168.200.211:9200","192.168.200.212:9200","192.168.200.213:9200"]
  indices:
   - index: "nginx-access-%{[beat.version]}-%{+yyyy.MM}"
     when.contains:
       tags: "access"
   - index: "nginx-error-%{[beat.version]}-%{+yyyy.MM}"
     when.contains:
       tags: "error"
setup.template.name: "nginx"
setup.template.pattern: "nginx-*"
2
3
4
5
6
7
8
9
10
11
12
13
14
15
16
17
18
19
20
21
22
23
24
25
# 9.6 java
filebeat.inputs:
- type: log
  enabled: true
  paths:
    - /opt/tomcat8.5/logs/localhost_access_log*.txt
  json.keys_under_root: true
  overwrite_keys: true
  tags: ["access"]
- type: log
  enabled: true
  paths:
    - /var/log/elasticsearch/elasticsearch.log
  tags: ["es"]
  multiline.pattern: '^\['
  multiline.negate: true
  multiline.match: after
output.elasticsearch:
  hosts: ["192.168.200.211:9200","192.168.200.212:9200","192.168.200.213:9200"]
  indices:
   - index: "tomcat-access-%{[beat.version]}-%{+yyyy.MM}"
     when.contains:
       tags: "access"
   - index: "es-java-%{[beat.version]}-%{+yyyy.MM}"
     when.contains:
       tags: "es"
setup.template.name: "tomcat"
setup.template.pattern: "tomcat-*"
2
3
4
5
6
7
8
9
10
11
12
13
14
15
16
17
18
19
20
21
22
23
24
25
26
27
28
# 9.7 logstash配置
例:

input {
    file {
		type => "tms_inbound.log"
		path => "/JavaWeb/tms2.wltest.com/logs/tms_inbound.es.*.log"
		codec => json {
				charset => "UTF-8"
			}
    }

    file {
		type => "tms_outbound.log"
		path => "/JavaWeb/tms2.wltest.com/logs/tms_outbound.es.*.log"
		codec => json {
				charset => "UTF-8"
			}
    }
}


output {

	if [type] == "tms_inbound.log" {
	   elasticsearch { hosts => "10.230.3.183:9200"
						index =>  'tms_inbound.log-%{+YYYY.MM.dd}'
						codec => "json" }
		}
	else{
	  elasticsearch { hosts => "10.230.3.183:9200"
						index => 'tms_outbound.log-%{+YYYY.MM.dd}'
						codec => "json" }
		}

}
总结:如果我们要配置多个input,然后根据不同input的type来配置不同的到处方式。

下面是我个人在用的一个配置文件,一方面获取linux系统日志,一方面获取nginx日志


下面是个人配置源配置文件

input {
    file {
	type =>"nginxlog"
        path =>"/usr/local/nginx/logs/access.log"
        start_position => "beginning"
        sincedb_path => "/home/write"
        tags => "shooter_tag"
        #delimiter => "\n"
        discover_interval => 15
        stat_interval => 1
        sincedb_write_interval => 15
        codec => "json"
        #codec => multiline {
        #    pattern => "^\d"
        #    negate => true
        #    what => "previous"
        #}
    }

    file {
        path => "/var/log/messages"
        type => "systemlog"
        start_position => "beginning"
        stat_interval => "2"
    }
}
filter {
    mutate {
        gsub => ["message", "\\x", "\\\x"]
    }
    json {
        source => "message"
        remove_field => "message"
        remove_field => "severity"
        remove_field => "pid"
        remove_field => "logsource"
        remove_field => "timestamp"
        remove_field => "facility_label"
        remove_field => "type"
        remove_field => "facility"
        remove_field => "@version"
        remove_field => "priority"
        remove_field => "severity_label"
    }
    date {
        match => ["time_local", "ISO8601"]
        target => "@timestamp"
    }
    grok {
        match => { "time_local" => "(?<day>.{10})" }
    }
    grok {
        match => { "request" => "%{WORD:method} (?<url>.* )" }
    }
    grok {
        match => { "http_referer" => "(?<referer>-|%{URIPROTO}://(?:%{USER}(?::[^@]*)?@)?(?:%{URIHOST})?)" }
    }
    mutate {
        remove_field => "request"
        remove_field => "http_referer"
        rename => { "http_user_agent" => "agent" }
        rename => { "upstream_response_time" => "response_time" }
        rename => { "host" => "log_source" }
        rename => { "http_x_forwarded_for" => "x_forwarded_for" }
        split => { "x_forwarded_for" => ", " }
        split => { "response_time" => ", " }
    }
    #alter {
    #    condrewrite => [
    #        "x_forwarded_for", "-", "0.0.0.0",
    #        "x_forwarded_for", "unknown", "0.0.0.0",
    #        "response_time", "-", "0",
    #        "real_ip", "", "0.0.0.0"
    #    ]
    #}
}

output {
    if [type] == "nginxlog" {
    elasticsearch {
	hosts => ["192.168.6.121:9200"]
        action=>"index"
        index => "nginx-tologs-%{+YYYY.MM.dd}"
        user => elastic
        password => changeme
        manage_template => true
        template_overwrite => true
        template_name => "mynginx"
        template => "/opt/logstash-5.6.4/template/mynginxtemplate.json"
        codec => json
    }
    file {
        flush_interval => 600
        path => '/home/nginxlog/nginx_tologs-%{+YYYY.MM.dd}.log'
    }
   }
   if [type] == "systemlog" {

  	elasticsearch {
        	hosts => ["192.168.6.121:9200"]
        	index => "logstash-systemlog-%{+YYYY.MM.dd}"
  	}
   	file {
        	path => "/home/nginxlog/logstash-systemlog-%{+YYYY.MM.dd}"

  	}
   }
}
2
3
4
5
6
7
8
9
10
11
12
13
14
15
16
17
18
19
20
21
22
23
24
25
26
27
28
29
30
31
32
33
34
35
36
37
38
39
40
41
42
43
44
45
46
47
48
49
50
51
52
53
54
55
56
57
58
59
60
61
62
63
64
65
66
67
68
69
70
71
72
73
74
75
76
77
78
79
80
81
82
83
84
85
86
87
88
89
90
91
92
93
94
95
96
97
98
99
100
101
102
103
104
105
106
107
108
109
110
111
112
113
114
115
116
117
118
119
120
121
122
123
124
125
126
127
128
129
130
131
132
133
134
135
136
137
138
139
140
141
142
143
144
145
146
147
148
149
150
151
152
153
154
155
156
157
158
159
160
161
162
163
164
165
166
167
168
169
170
171
172
173
174
175
176
177
178
179
180
181
182
183
184
185
186
187
188
189
190
191
192
193
194
195
196
197
198
199
200
201
202
203
204
205
206
207
208
209
210
211
212
213
214
215
216
217
218
219
220
221
222
223
224
225
226
227
228
229
230
231
232
233
234
235
236
237
238
239
240
241
242
243
244
245
246
247
248
249
250
251
252
253
254
255
256
257
258
259
260
261
262
263
264
265
266
267
268
269
270
271
272
273
274
275
276
277
278
279
280
281
282
283
284
285
286
287
288
289
290
291
292
293
294
295
296
297
# 10.elk架构图参考
# 11.kibana日志分析图展示